Why PVGeo?
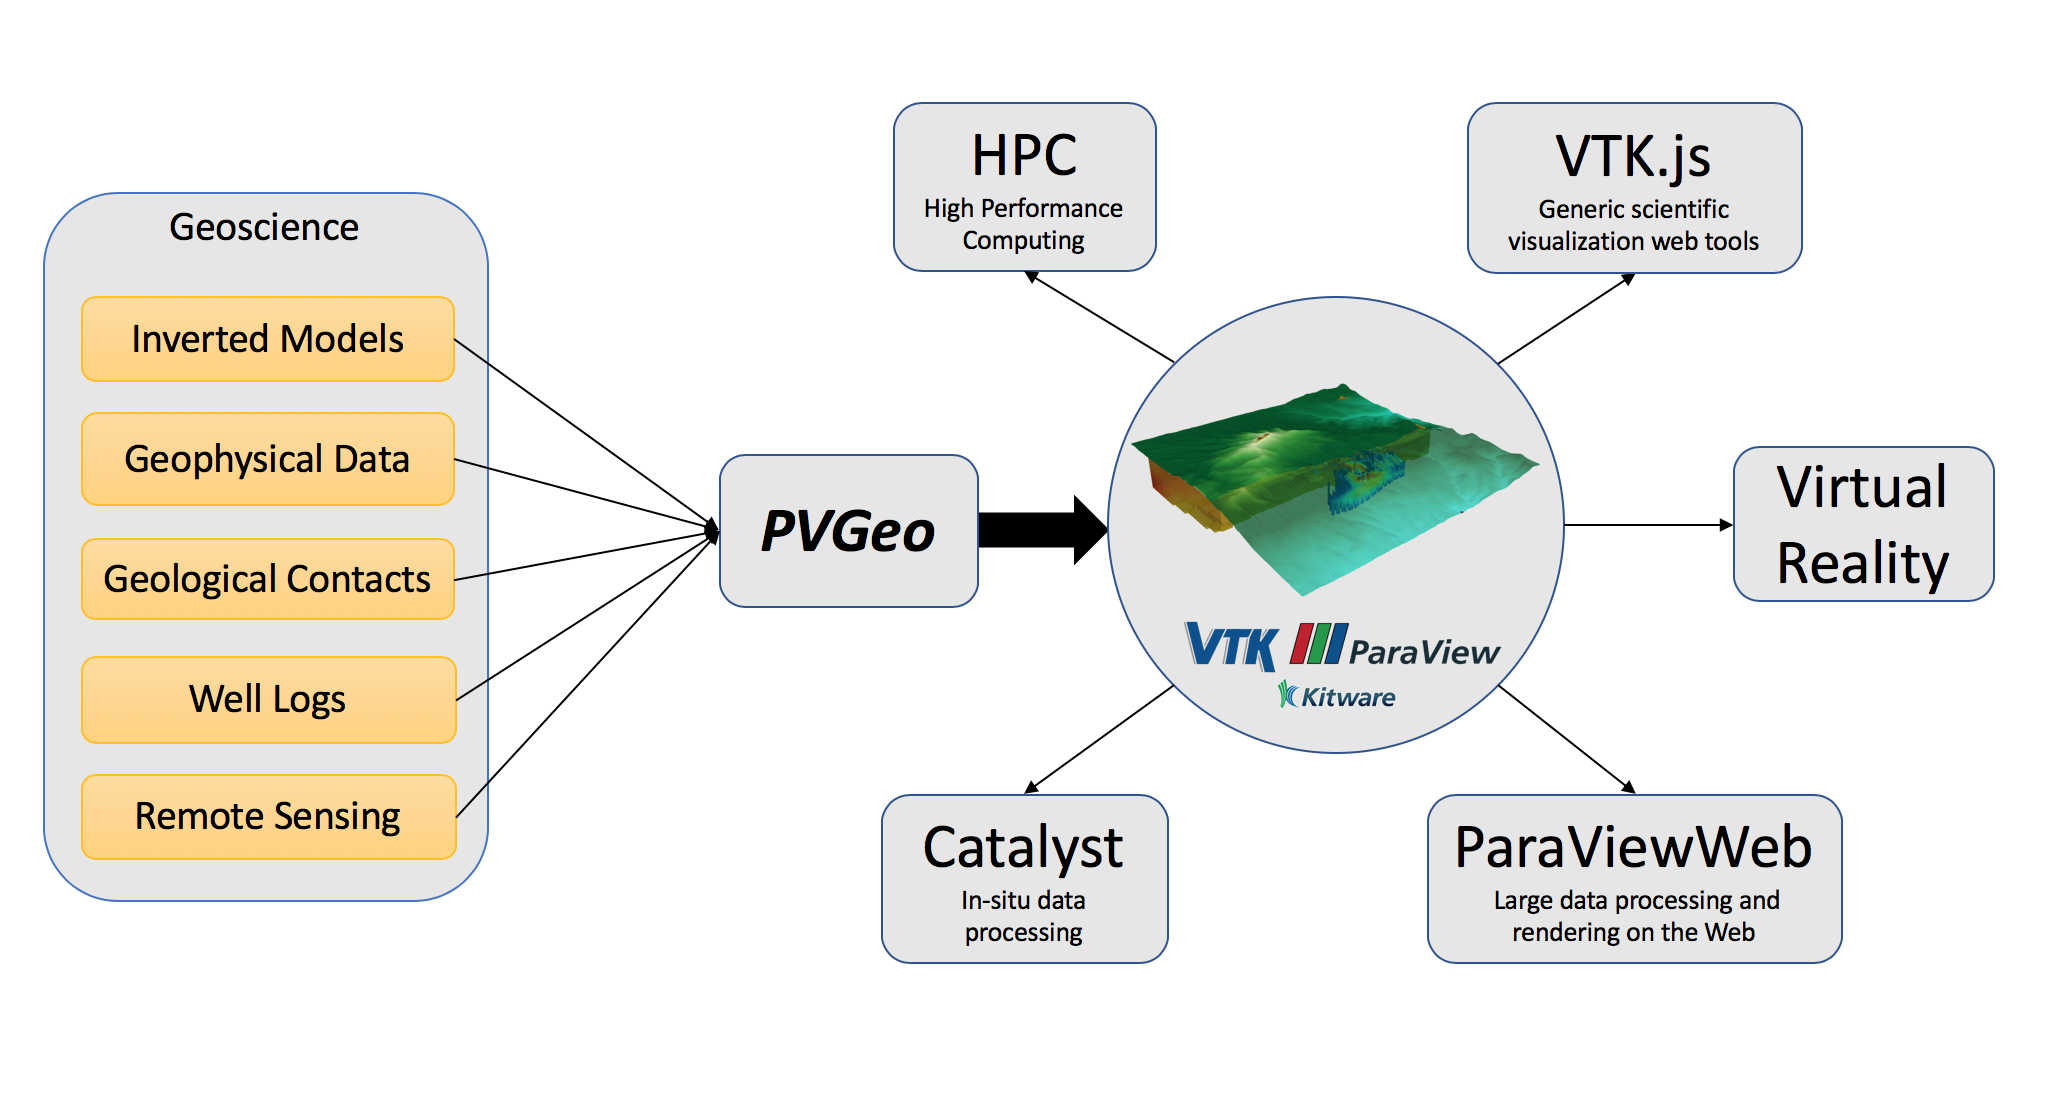
PVGeo is an open-source Python package for geoscientific visualization and
analysis harnessing an already powerful software platform: the
Visualization Toolkit (VTK) and its Python wrappings in
PyVista.
The VTK software platform is well-maintained, contains an expansive set of
native functionality, and provides a robust foundation for scientific
visualization, yet the development of tools compatible for geoscience data and
models has been very limited.
As a software extension package to VTK and ParaView, PVGeo addresses the lack of
geoscientific compatibility by creating a framework for geo-visualization.
This framework is a set of tools for visually integrating geoscience data and
models directly within ParaView’s graphical user interface, simplifying the
required routines to make compelling visualizations of geoscientific datasets.
The PVGeo package is available for download on PyPI
(pip install PVGeo), documented on this website, and open-source on
GitHub for community-driven developments.
About the Project
These tools here are tailored to the visualization of spatially referenced data in the geosciences, especially geophysics. The overarching goal of this project is to develop set of codes to visually integrate post-processed data for more intuitive visualization. To make more intuitive visualizations, we think it is necessary to reference data in relation to features like topography, well locations, survey points, or other known features that are easier to spatially grasp.
This code base deploys tools to perform post-processing visual analysis and interpretation of geophysical data and models and we hope that geophysicists will gain an ability to represent their 3D spatially referenced data intuitively to interested parties and stakeholders. By integrating the visualization of various data, and creating a sort of visual data fusion, interested parties will gain insight into the value of the information in their models. Through visual integration, we try to mimic the reality of the space in which data was acquired so that it will hold meaning to anyone that immerses into the visualization regardless of background.