Note
Go to the end to download the full example code.
Append Cell Centers
This example will demonstrate how to append a dataset’s cell centers as a length 3 tuple array.
This example demonstrates PVGeo.filters.AppendCellCenters
from pyvista import examples

from PVGeo.filters import AppendCellCenters
Use an example mesh from pyvista
mesh = examples.load_rectilinear()
mesh
Run the PVGeo algorithm
centers = AppendCellCenters().apply(mesh)
centers
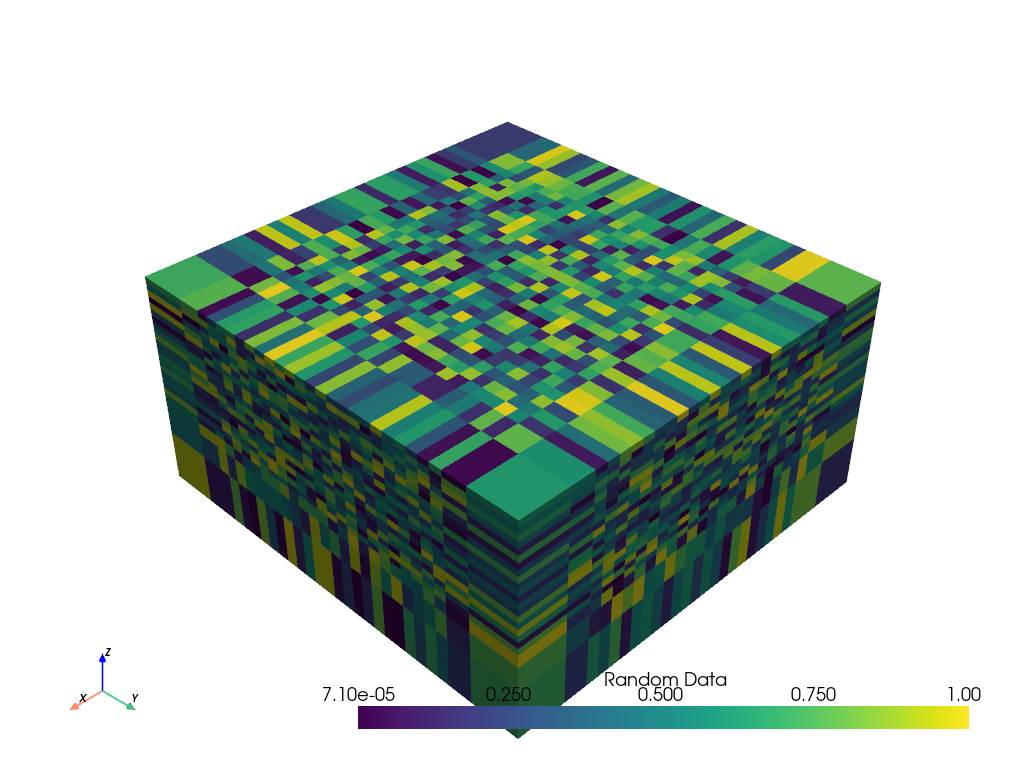
centers.plot()
Total running time of the script: (0 minutes 1.053 seconds)