Note
Go to the end to download the full example code.
Read SGeMS Grid
Read SGeMS Grid file formats.
# sphinx_gallery_thumbnail_number = 2
import os

import pooch

from PVGeo.gslib import SGeMSGridReader
# grid_url = 'http://www.trainingimages.org/uploads/3/4/7/0/34703305/a_wlreferencecat.zip'
url = "https://raw.githubusercontent.com/pyvista/vtk-data/master/Data/A_WLreferenceCAT.sgems"
file_path = pooch.retrieve(url=url, known_hash=None)

grid = SGeMSGridReader().apply(file_path)
grid
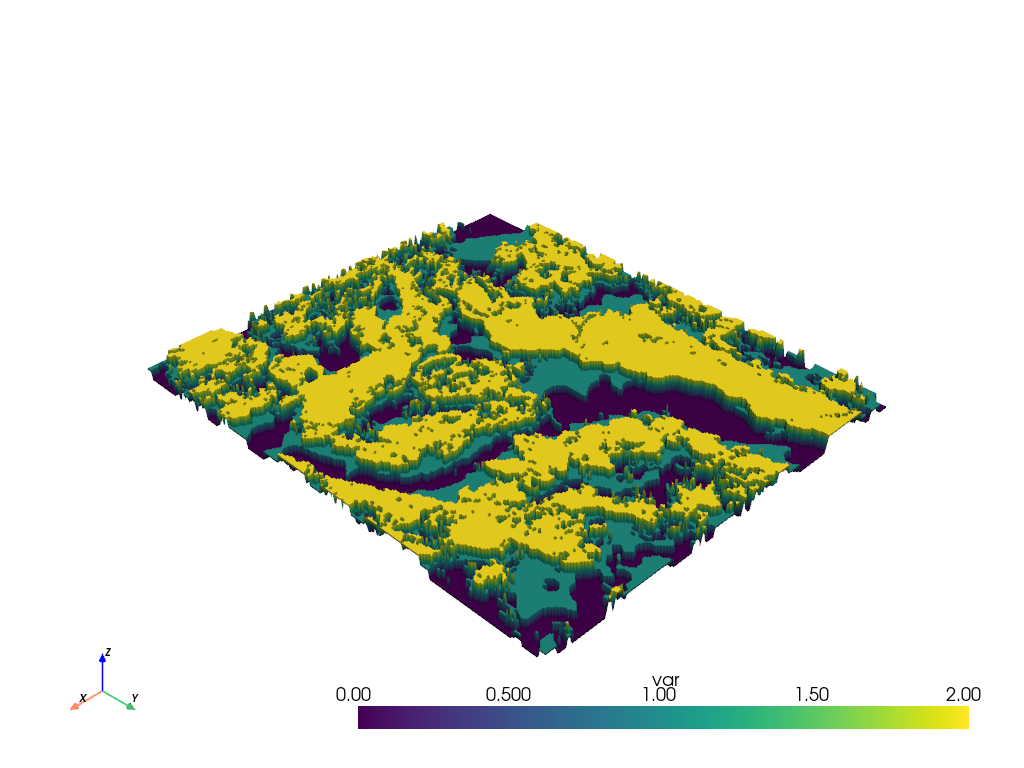
warped = grid.cell_data_to_point_data().warp_by_scalar(scale_factor=5)
warped.plot()
# grid_url = 'http://www.trainingimages.org/uploads/3/4/7/0/34703305/maules_creek_3d.zip'
url = "https://raw.githubusercontent.com/pyvista/vtk-data/master/Data/Maules_Creek_3D.SGEMS.zip"
file_paths = pooch.retrieve(url=url, known_hash=None, processor=pooch.Unzip())
file_path = [f for f in file_paths if os.path.basename(f) == "Maules_Creek_3D.SGEMS"][0]
file_path
'/home/runner/.cache/pooch/db952eed0c325d1a10fc03d53f46f9a9-Maules_Creek_3D.SGEMS.zip.unzip/Maules_Creek_3D.SGEMS'
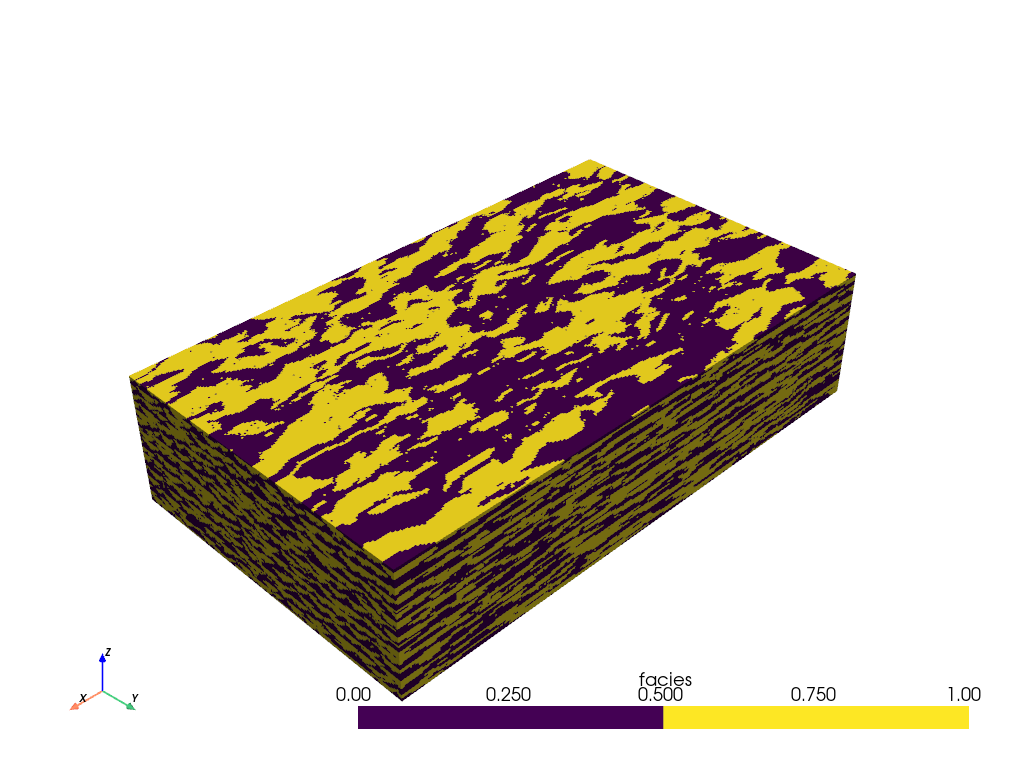
grid = SGeMSGridReader().apply(file_path)
grid
grid.plot(categories=True)
# grid_url = 'http://www.trainingimages.org/uploads/3/4/7/0/34703305/ti_horizons_continuous.zip'
url = "https://raw.githubusercontent.com/pyvista/vtk-data/master/Data/TI_horizons_continuous.SGEMS.zip"
file_paths = pooch.retrieve(url=url, known_hash=None, processor=pooch.Unzip())
file_path = [f for f in file_paths if os.path.basename(f) == "TI_horizons_continuous.SGEMS"][0]
file_path
'/home/runner/.cache/pooch/cb332143f44792c75fe40091d3efa739-TI_horizons_continuous.SGEMS.zip.unzip/TI_horizons_continuous.SGEMS'
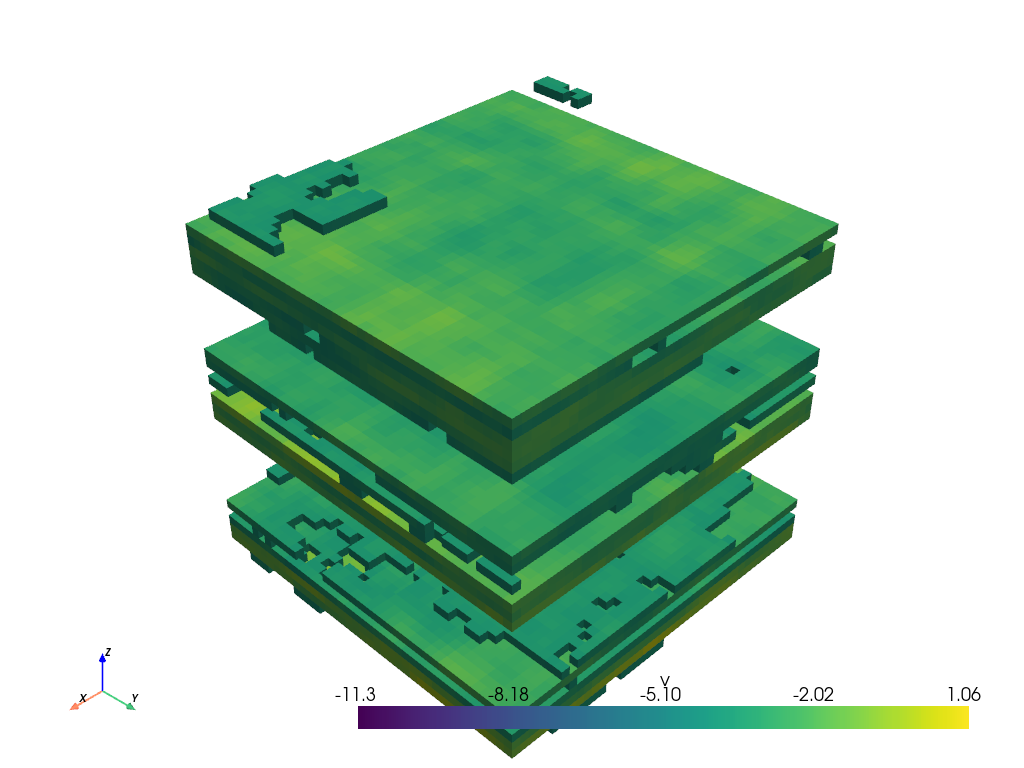
grid = SGeMSGridReader().apply(file_path)
grid.threshold([-4, 1.06]).plot(clim=grid.get_data_range())
# grid_url = 'http://www.trainingimages.org/uploads/3/4/7/0/34703305/ti.zip'
url = "https://raw.githubusercontent.com/pyvista/vtk-data/master/Data/ti.sgems.zip"
file_paths = pooch.retrieve(url=url, known_hash=None, processor=pooch.Unzip())
file_path = [f for f in file_paths if os.path.basename(f) == "ti.sgems"][0]
file_path

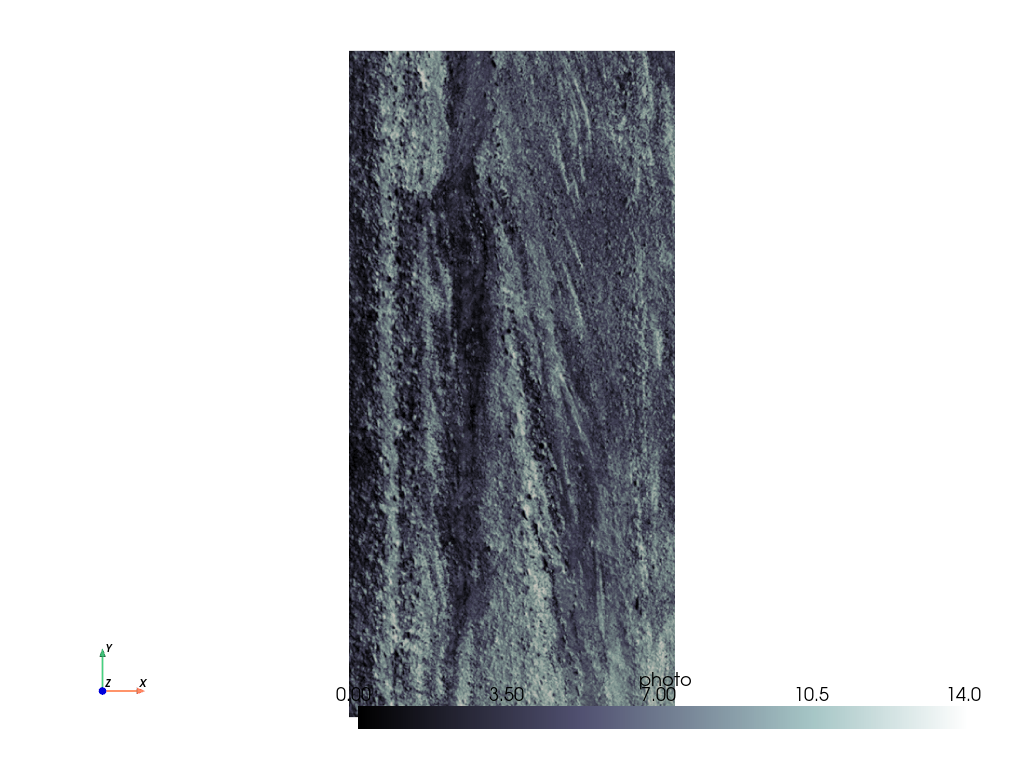
grid = SGeMSGridReader().apply(file_path)
grid.plot(scalars="photo", cpos="xy", cmap="bone")
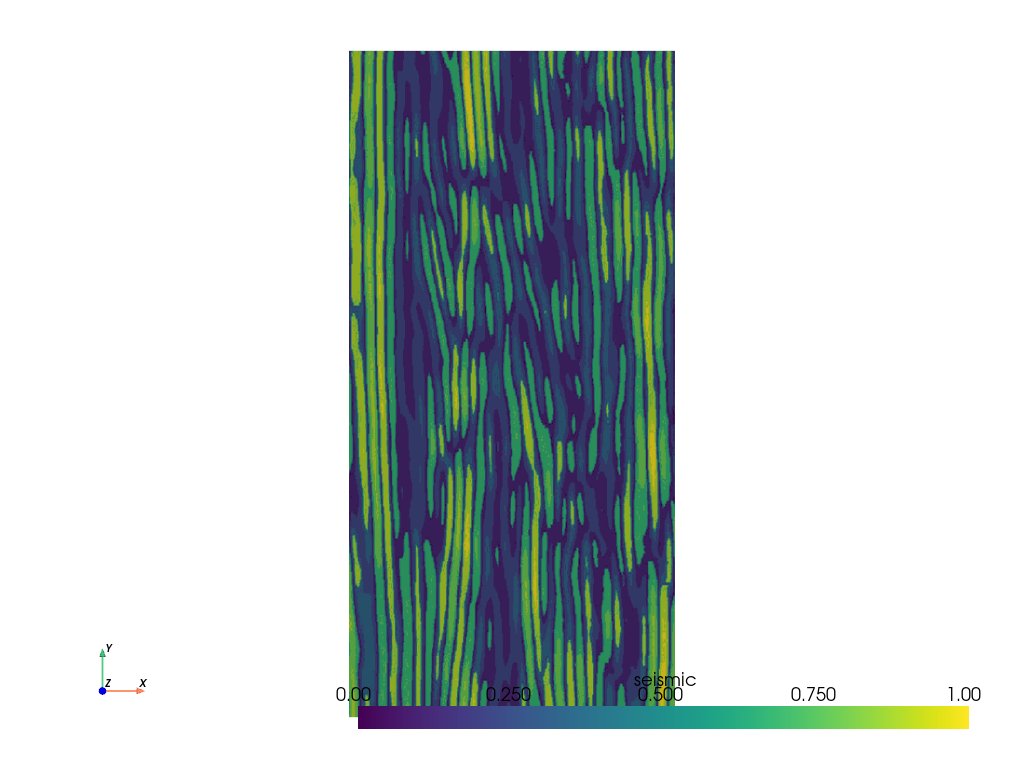
grid.plot(scalars="seismic", cpos="xy")
Total running time of the script: (0 minutes 31.984 seconds)