Note
Go to the end to download the full example code.
Extract Array to Table
This example will demonstrate how to extract an array from any input data set
to make a pyvista.Table of that single data array. Aftwards, we plot
a histogram of that data array.
This example demos PVGeo.filters.ExtractArray
import matplotlib.pyplot as plt
from pyvista import examples

from PVGeo.filters import ExtractArray
Create input data
dataset = examples.download_st_helens()
Construct the filter
filt = ExtractArray()
# Define the array to extract
# Apply the filter on the input
table = filt.apply(dataset, "Elevation")
table
plt.hist(table["Elevation"])
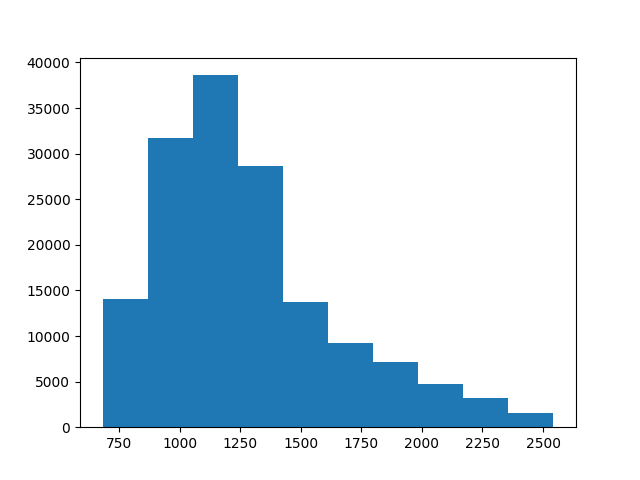
(array([14075., 31732., 38605., 28616., 13749.,  9270.,  7174.,  4687.,
        3199.,  1602.]), array([ 682.        ,  868.09997559, 1054.19995117, 1240.30004883,
       1426.40002441, 1612.5       , 1798.60009766, 1984.70007324,
       2170.80004883, 2356.89990234, 2543.        ]), <BarContainer object of 10 artists>)
Total running time of the script: (0 minutes 0.847 seconds)