Note
Go to the end to download the full example code.
Voxelize Points
This example will demonstrate how to connect a set of points defined on a regular grid to create a vtkUnstructuredGrid which can be used to perform volumetric operations.
This example demos PVGeo.filters.VoxelizePoints
# sphinx_gallery_thumbnail_number = 2
import pandas as pd
import pooch
import pyvista

import PVGeo
Download sample data files and keep track of names:
url = "https://github.com/OpenGeoVis/PVGeo/raw/main/tests/data/fault_points.csv"
file_path = pooch.retrieve(url=url, known_hash=None)
Let’s go ahead and load a simple file that has XYZ coordinates and a boolean array for fault presence. This point cloud makes some sort of regular grid, but we have forgotten the details of the cell spacings and local coordinate rotations.
We will read in this data with pandas and send it to the
PVGeo.points_to_poly_data() helper to create a pyvista.PolyData
object (essentially a point cloud).
points = pd.read_csv(file_path)
print(points[0:2])
            X            Y       Z  Fault
0  326819.497  4407450.636  1287.5      0
1  326834.340  4407470.753  1287.5      0
vtkpoints = PVGeo.points_to_poly_data(points)
vtkpoints
Note that we have a pyvista.PolyData object now which allows us to do
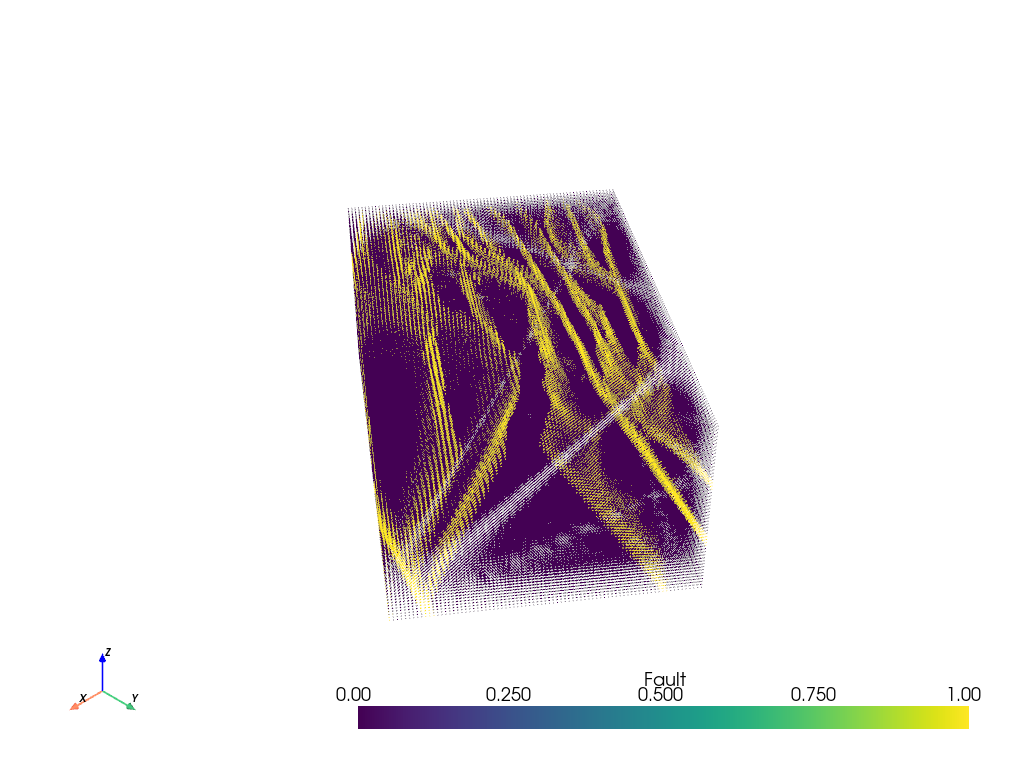
all types of immediate plotting of our data. First, lets threshold our points
as the point cloud has a bunch of zeros and ones throughout the dataspace to
describe the presence of a fault.
To threshold the points, we call the threshold filter directly on our data
object and pass the thresholding value. We can then plot the result by
calling the plot function. (Note: change the notebook parameter to
False for an interactive window)
vtkpoints.plot(clim=[0, 1], point_size=1)
Points to Voxelized Volume
The above figure is pretty cool! But it is a point cloud which means out filtering options are pretty limited. Fortunately, we know that the point cloud represents some sort of regularized gridded volume of data and PVGeo has a filter to recover that volume. This will allow further volumetric operations can be performed with other PVGeo or VTK filters.
Remember that these points are rotated and we do not know the cell sizes… this is okay! The VoxelizePoints filter from PVGeo will handle the recovery of the coordinate rotation and grid our data without running an interpolation scheme. The VoxelizePoints filter assumes that the points are structured on some rotated XY-plane with regular cell spacings and does the rest on its own! Check out VoxelizePoints code docs for more details. The full pipeline method
print("Voxelizing... ", end="")
voxelizer = PVGeo.filters.VoxelizePoints()
grid = voxelizer.apply(vtkpoints)
print("done.")

# Output the results
print("Recovered Angle (deg.): %.3f" % voxelizer.get_angle())
print("Recovered Cell Sizes: (%.2f, %.2f, %.2f)" % voxelizer.get_spacing())
grid
Voxelizing... done.
Recovered Angle (deg.): 53.550
Recovered Cell Sizes: (25.00, 25.00, 25.00)
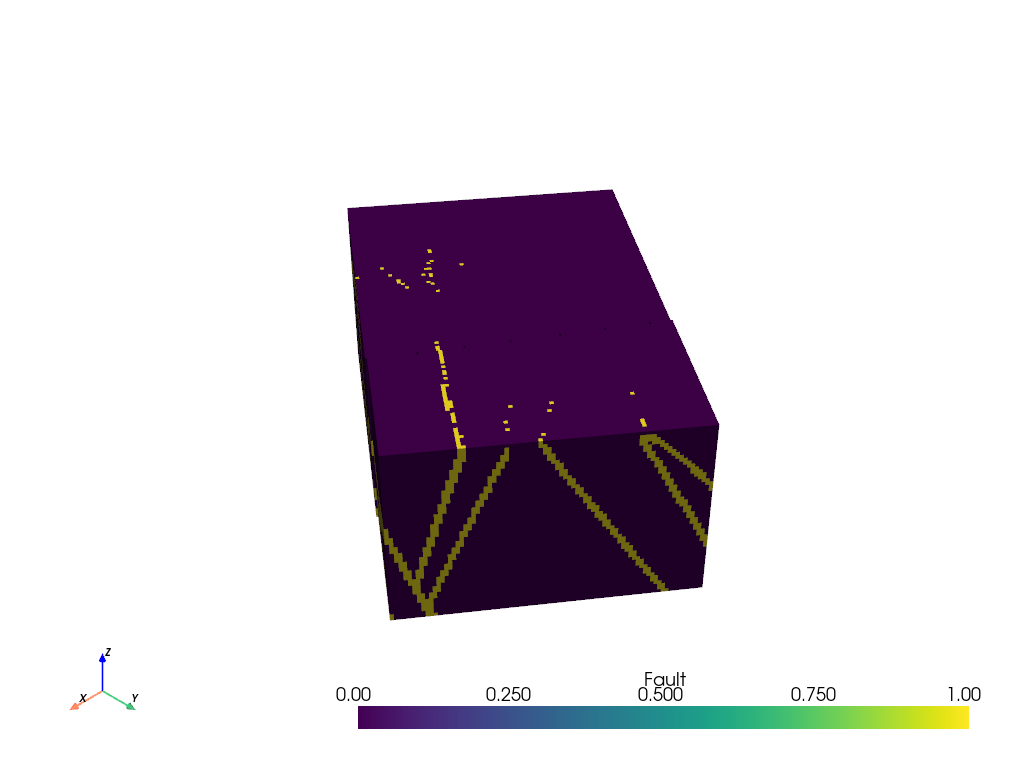
And now we can plot the voxelized volume
grid.plot()
Filter Volumetric Data
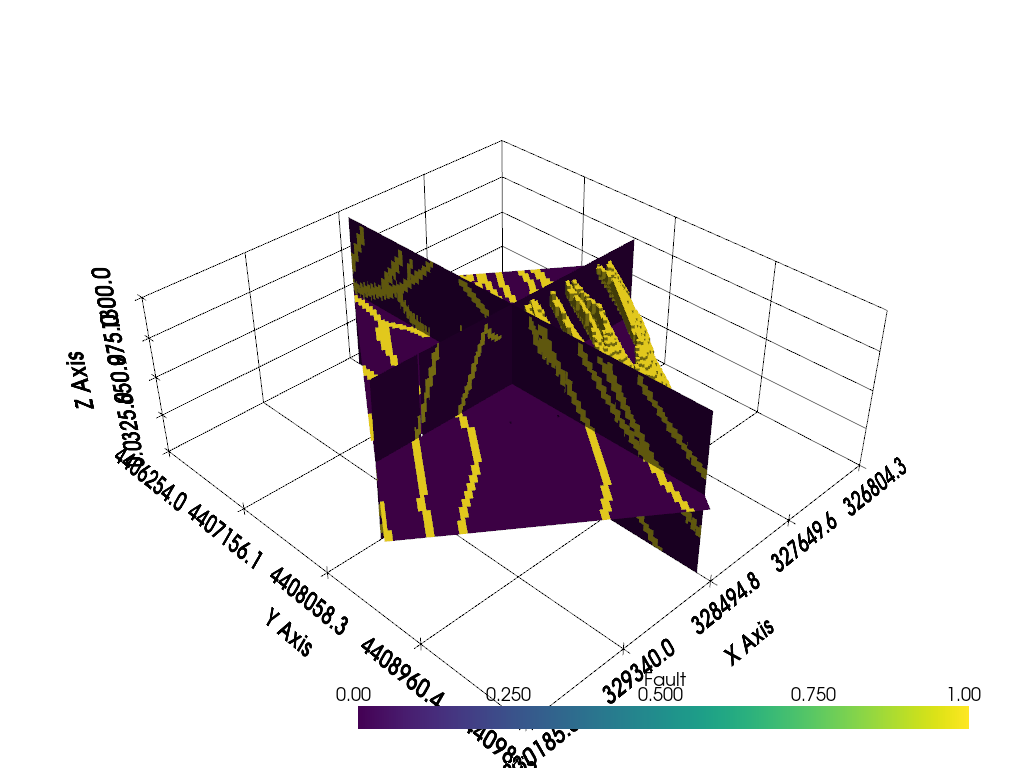
Now lets use one of PyVista’s filters to create slices of the thresholded
dataset. Specifically, we are using the slice_orthogonal filter that will
create 3 orthogonal slices through a data volume.
slices = grid.slice_orthogonal()
slices
And let’s use a clip filter:
clip = grid.clip(normal="x").clip(normal="-y").threshold(0.5)
Now display the slices and clipped volume
p = pyvista.Plotter()
p.add_mesh(slices)
p.add_mesh(clip)
p.show_grid()
p.show()
Total running time of the script: (0 minutes 16.427 seconds)