Note
Go to the end to download the full example code.
Many Slices Along Points
This example will demonstrate how to slice a 3D data source along some arbitrary line or sequence of points specified in another data source to have many slices of the 3D data perpendicular to that travel path.
Sometimes, we desire to take a path through a model and construct various slices along that path. This example will outline a filter we have developed to take some 3D data set on the pipeline and construct various slices of that model along an input path. The slices will be perpendicular to that path at specified intervals. In this example, we also demonstrate a filter that comes native in ParaView to slice that entire model along the travel path to have a single warped slice.
This example demos PVGeo.filters.ManySlicesAlongPoints
import numpy as np
sphinx_gallery_thumbnail_number = 3
import pyvista
from pyvista import examples

import PVGeo
from PVGeo.filters import ManySlicesAlongPoints
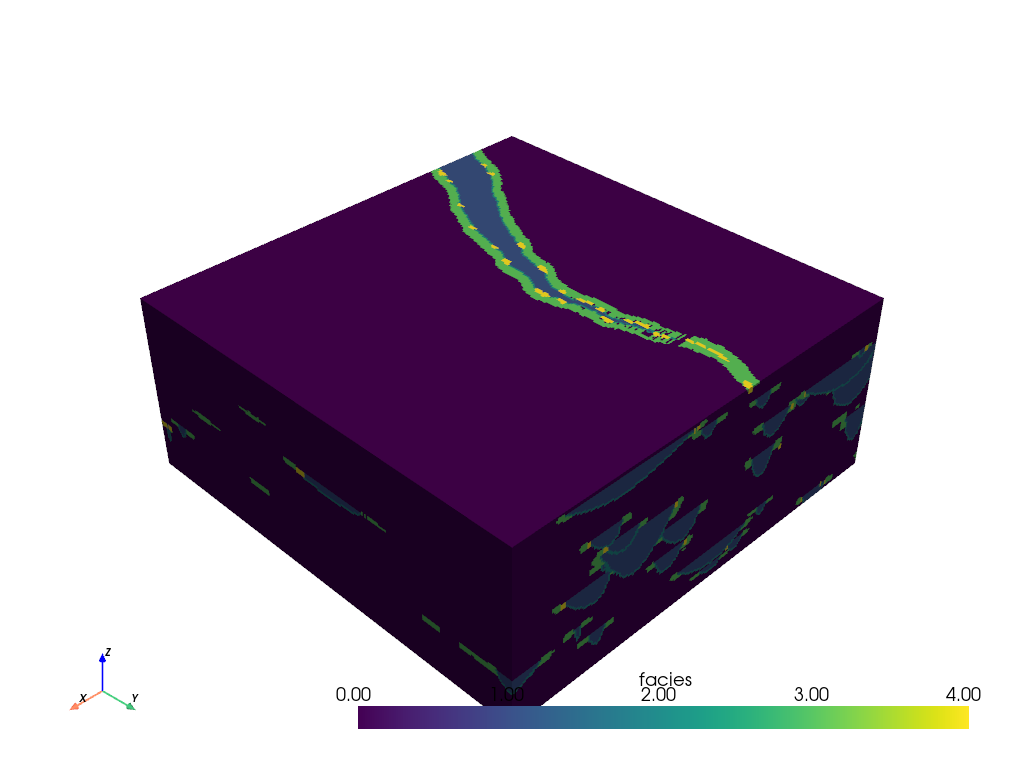
Load a volumetric model to be sliced from pyvista’s examples
model = examples.load_channels()
model.plot()
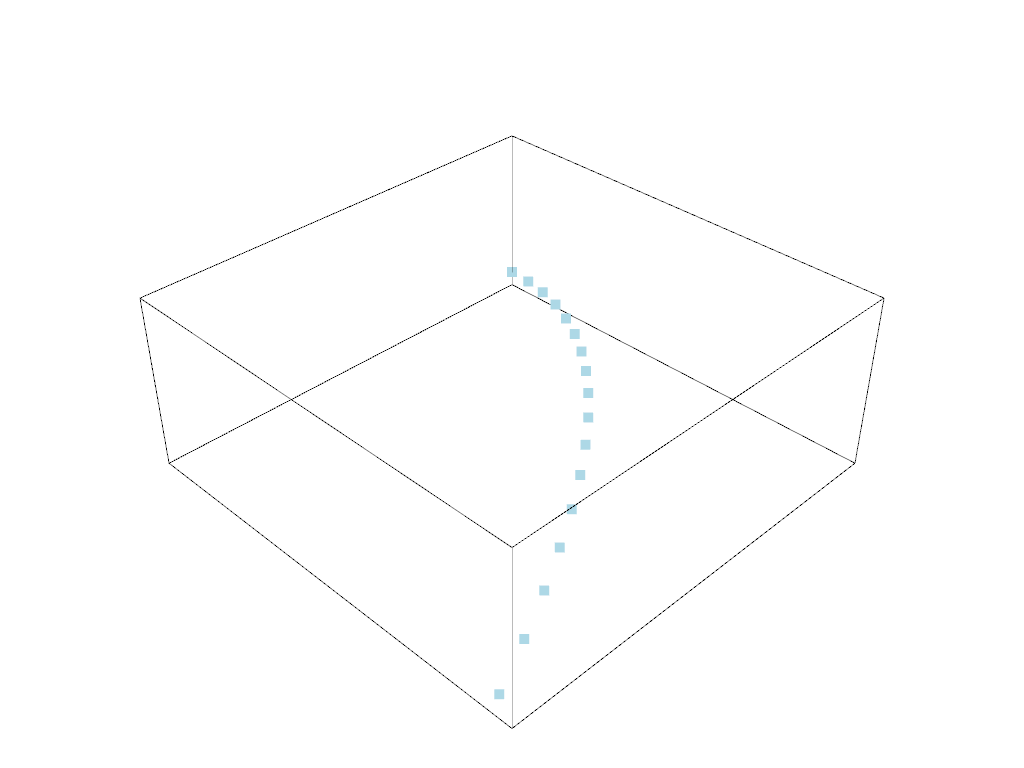
Create a series of points that move through that model. These are the points we will use to slice the volume.
def path(y):
    """Equation: x = a(y-h)^2 + k"""
    a = 110.0 / 160.0**2
    x = a * y**2 + 0.0
    return x, y


x, y = path(np.arange(model.bounds[2], model.bounds[3], 15.0))
zo = np.linspace(9.0, 11.0, num=len(y))
# Make a VTK data object for the filter to use
points = pyvista.PolyData(np.c_[x, y, zo])

p = pyvista.Plotter()
p.add_mesh(model.outline(), color="k")
p.add_mesh(points, point_size=10.0)
p.show()
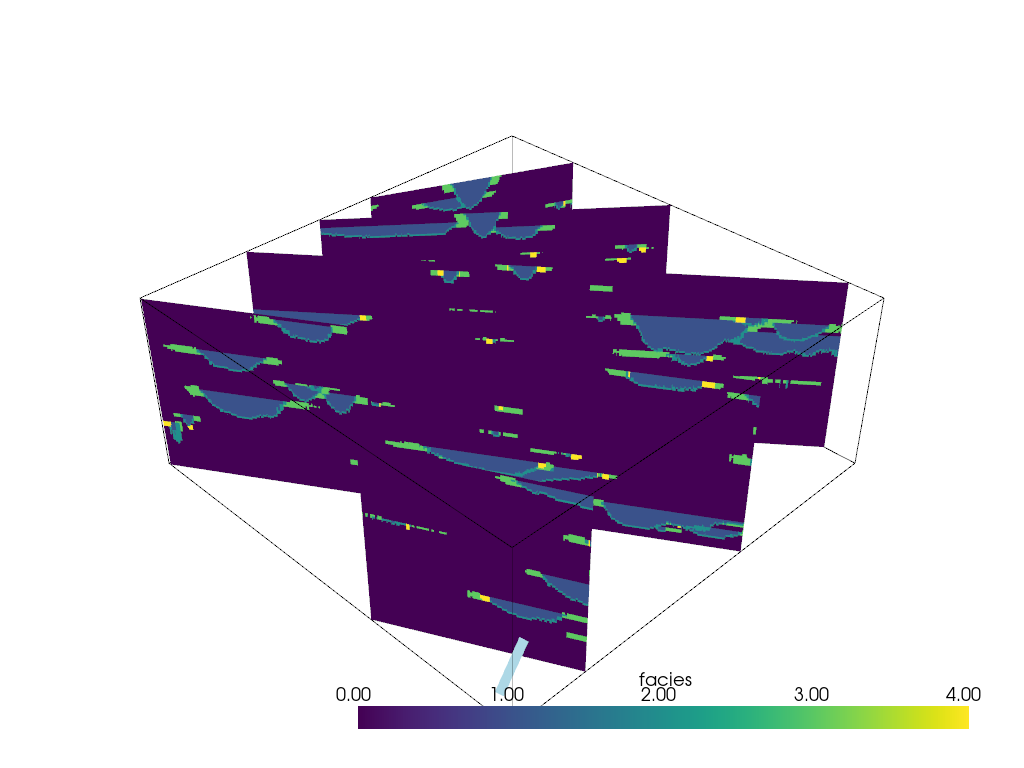
Now we can use the Many Slices Along Points filter. Specify the model as the dataset input and the points as the points input to that filter and apply the algorithm. That’s it! The filter should be applied and you can fine tune the number of slices to what you prefer!
slices = ManySlicesAlongPoints(n_slices=5).apply(points, model)
slices
line = PVGeo.filters.AddCellConnToPoints().apply(points)
p = pyvista.Plotter()
p.add_mesh(line, line_width=10)
p.add_mesh(slices, lighting=False)
p.add_mesh(model.outline(), color="k")
p.show()
Total running time of the script: (0 minutes 5.163 seconds)