Note
Go to the end to download the full example code.
Normalize Array
This example will demonstrate how to perform a normalization or any custom mathematical operation on a single data array for an input data set.
This filter allow the user to select an array from the input data set to be normalized. The filter will append another array to that data set for the output. The user can specify how they want to rename the array, can choose a multiplier, and can choose from two types of common normalizations: Feature Scaling and Standard Score.
This example demos PVGeo.filters.NormalizeArray
from pyvista import examples

from PVGeo.filters import NormalizeArray
Create some input data. this can be any vtkDataObject
mesh = examples.load_uniform()
title = "Spatial Point Data"
mesh.plot(scalars=title)

# Apply the filter
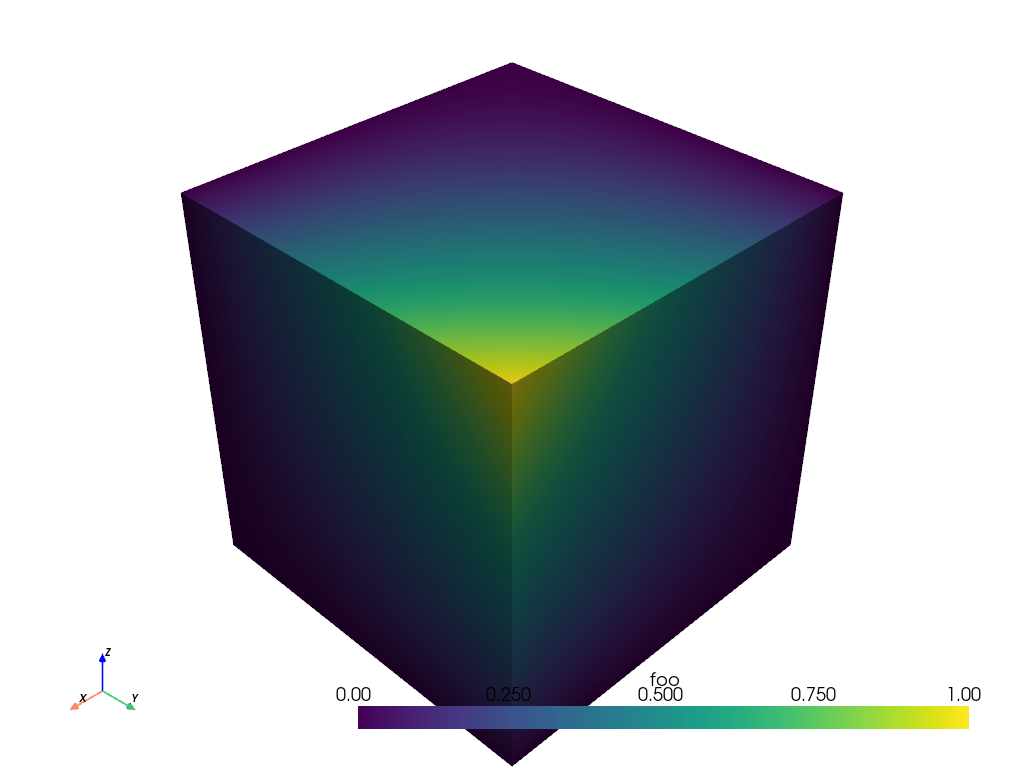
f = NormalizeArray(normalization="feature_scale", new_name="foo")
output = f.apply(mesh, title)
output
output.plot(scalars="foo")
Total running time of the script: (0 minutes 0.513 seconds)